
Salesforce CRM Analytics unfortunately doesn't provide a histogram widget out of the box. However, it is possible to use column chart to achieve acceptable results. Additionally, I will explain how to calculate the average price per Product and country, or per Product and Account.

For how much are we actually selling?
It is not uncommon to offer a discount to a potential client in order to win an Opportunity. When doing so, sales managers are interested in seeing the actual prices at which products are sold as well as the average price of the product sold in the country and to the same client in the past.
To be able to follow the steps below, you need to have Salesforce CPQ installed on your org.
Average price per country
Let’s start with calculating average price. For this we will use Net Value on the Quote Line related to Accepted Quotes. First, we will prepare the Quote Lines.
- Open Data Manager and add following objects to Connections:

- Account (Account)
- Billing Country (BillingCountry)
- Name (Name)
- Product (Product2)
- Name (Name)
- Product Code (ProductCode)
- Quote (SBQQ_Quote__c)
- Account (SBQQ__Account__c)
- Quote Number (Name)
- Status (SBQQ__Status__c)
- Quote Line (SBQQ__QuoteLine__c)
- Line Name (Name)
- Net Unit Price (SBQQ__NetPrice__c)
- Product (SBQQ__Product__c)
- Quote (SBQQ_Quote__c)
- Account (Account)
- Create a Recipe and add Accounts, Products, Quotes, and Quotes Lines as inputs.

- Join Quote with Quote Lines using a LookUp on Quote Id.

- Join resulting node with Account using a LookUp on Account Id.

- Join resulting node with Product using a LookUp on Product Id.

- Filter Accepted Quotes.

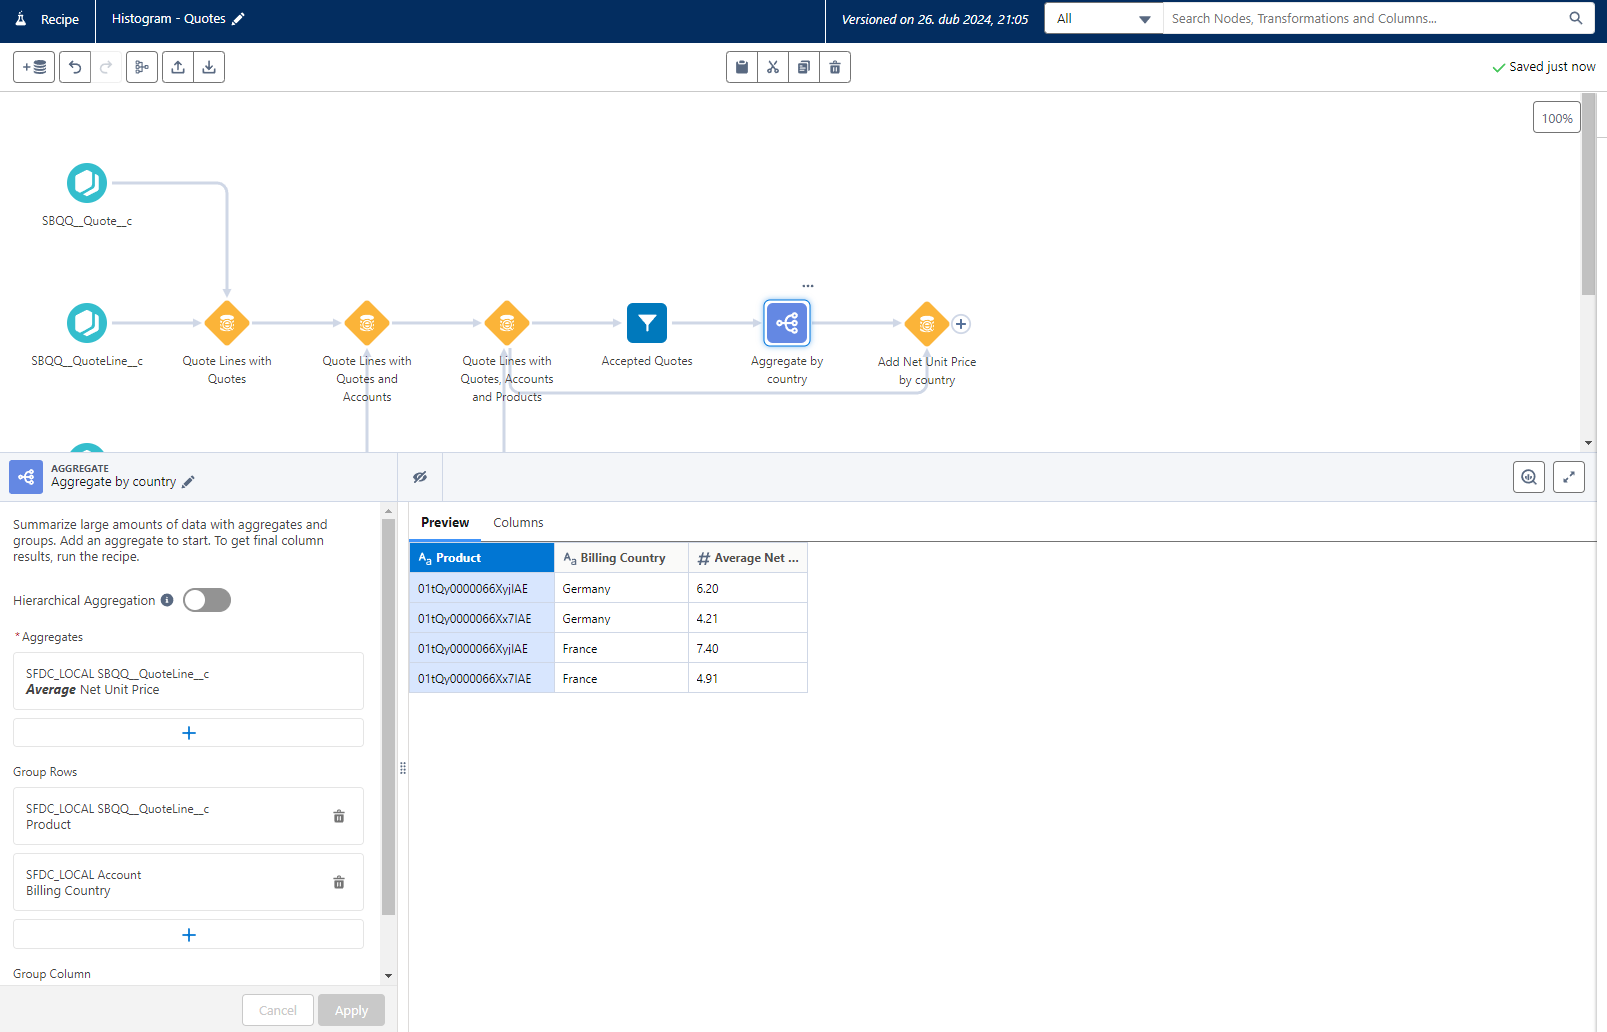
- Use Aggregate:
- Aggregates: Average Net Unit Price

- Rows: Product Id, Billing Country
- Aggregates: Average Net Unit Price
- Join resulting node with Quote Lines using a LookUp on Product Id and Billing Country.

- Use Aggregate on Accepted Quotes again:

- Aggregates: Average Net Unit Price
- Rows: Product Id, Account Id
- Join resulting node with Quote Lines using a LookUp on Product Id and Account Id.

- Save the result into a dataset.

- Create a new dashboard.
- Create a new widget, a Comparable Table, built upon the dataset we created in a previous set of instructions.
- Add following columns into Columns (rename columns if needed):

- Net Unit Price
- Net Unit Price (Country Average)
- Net Unit Price (Account Average)
- Add the following columns into Group By:
- Account Name
- Quote Number
- Line Name
- Product Code
- Add a filter to exclude Accepted Quotes.

- Open the table with Quote Lines in Advanced Editor.
- In the Advanced Interactive Editor select the query used in the table as the Source Query.
- In the Source Data, choose "Cell" as Data Selection, "0" as Row Index and "Product Code" as the Column.

- Select "Selection" as Interactive Type.
- Copy the resulting binding to the side. It should look like this: {{cell(Open_Quotes_1.selection, 0, "Product.ProductCode").asString()}}, with the exception that the Query will be different.
- Place a chart in the dashboard.
- Add our Quote Lines dataset in the Datasets.
- Switch to Query Mode and use the following code (and adapt if necessarry):
q = load "HistogramQuoteLines"; -- Load the dataset created by our "histogram" recipe.
q = filter q by 'Quote.SBQQ__Status__c' == "Accepted"; -- Display only accepted Net Unit Prices.
q = filter q by 'Product.ProductCode' == "{{cell(Open_Quotes_1.selection, 0, "Product.ProductCode").asString()}}"; -- Display Net Unit Prices only for the product on the selected Quote Line.
q = group q by 'Id'; -- Treat each line individually.
q = foreach q generate 'Id' as 'Id', sum('SBQQ__NetPrice__c') as 'A'; -- Work only with Net Unit Price.
q = foreach q generate 'Id', 'A', round(A,1) as 'B', 1 as 'C'; -- Round Net Unit Price to 1 decimal place. Column C is used as a counter for accepted Quote Lines.

q1 = load "HistogramQuoteLines"; -- Display also selected value.
q1 = filter q1 by 'Name' == "{{cell(Open_Quotes_1.selection, 0, "Name").asString()}}"; -- Line Number is unique, so it can be used to find the price of the selected item.
q1 = group q1 by 'Id';
q1 = foreach q1 generate 'Id', sum('SBQQ__NetPrice__c') as 'B', 0 as 'C', sum('SBQQ__NetPrice__c') as 'D'; -- C is empty, so this row is not calculated into the number of accepted Quote Lines. Net Unit Price of selected Quote Line is in a separate column, so we can display it separately.

q = union q,q1; -- Combine both queries.

q = group q by 'B'; -- Group by rounded Net Unit Prices
q = foreach q generate 'B', sum(D) as 'Current Quote', sum(C) as 'Number of Quote Lines'; -- Display the results
- Run the Query and open the Chart Mode.
- Select column B as Bars (and rename it).
- Select Current Quote and Number of Quote Lines as Bar Length.

- Update the chart and don’t be frightened that you don’t see any results! Remember, it only works, when user selects a line in the table!
- Remove Apply global filters and Faceting, so that selections on other queries dosn’t affect the number of Quote Lines we are building our histogram on.

- In the widget, select Dual Axis for Axis Mode (Number of Quote Lines and Current Quote can be completely different numbers).


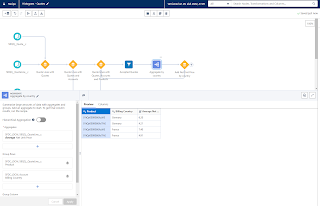
At this point, we need to take the Quote Lines we've prepared, filter out Accepted Quotes, and use Aggregation to calculate the average price per country and average price per Account. The resulting numbers need to be joined back to the original Quote Lines node. It might sound complicated, but when you see the picture, everything will become clear.


The job is complete. We have gathered Quote Lines with average prices. Now, we will proceed to create a histogram.
Quote Line Table
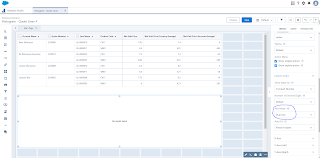
Before we create the histogram itself, we need to prepare a widget from which users can select the Quote Lines. We will use a Comparable Table (Values Table doesn’t allow selections).


If we observe the table, we can see, for example, that currently open quote for Leckeres Bier offers beers (Product Code: WB01) priced below the country average but well above the client’s usual price.

Conjuring up a histogram
The basic idea behind creating a histogram is to round the Net Unit Prices of the selected Product on Accepted Quotes and then group Quote Lines by calculated numbers. Yes, it‘s not something you can configure using the UI, but it is achievable in SAQL.
So, what’s the selected Product?

Now that we have the binding, we can start placing a new widget into the dashboard and prepare our SAQL. Commentarythe SAQL will be included in the code as comments.


What do we see?

Your chart should resemble the chart in the image above. Obviously, your chart will display completely different data, because your company is not selling Currywurst and Weisbier to some made-up companies.
On the histogram, you can see orange columns representing the number of accepted Quotes that were selling product WB01 (Weisbier) for price below the column. Blue column represents the actual price. So, what does it tell us? There were 3 accepted Quotes for significantly lower prices, but there are another 4 accepted Quotes with slightly higher prices. We are definitely offering a price at the top end of the scale, and we shouldn’t be afraid that our company would lose money on this deal. But will the client accept it?
How to improve it?
Well, of course, chart can be made nicer and more colourful, but most importantly, you can try to adjust the recipe and SAQL, so that we are not displaying just the number of Quotes with a given Net Unit Price, but also displaying the total Quantity sold for a given price. It will probably not work this well with a Column Chart, so I suggest trying a Combo chart.

Looking for an experienced Salesforce Architect?
- Are you considering Salesforce for your company but unsure of where to begin?
- Planning a Salesforce implementation and in need of seasoned expertise?
- Already using Salesforce but not fully satisfied with the outcome?
- Facing roadblocks in your Salesforce implementation and require assistance to progress?
Feel free to review my profile and reach out for tailored support to meet your needs!
hi
ReplyDeleteThanks for sharing this article here about the ------. Your article is very informative and I will share it with my other friends as the information is really very useful. Keep sharing your excellent work. Best Ai CRM Platform
ReplyDelete